I have a text file that contains something like this:
# Comment
# Comment
# Comment
# Comment

# Comment
  Comment
# Comment

#Raw SIFs at Crack Propagation Step: 0
# Vertex, X,              Y,              Z,              K_I,            K_II,           K_III,
  0      , 2.100000e+00   , 2.000000e+00   , -1.000000e-04  , 0.000000e+00   , 0.000000e+00   , 0.000000e+00  ,
  1      , 2.100000e+00   , 2.000000e+00   , 1.699733e-01   , 8.727065e+00   , -8.696262e-04  , -1.800691e-04  ,
  2      , 2.100000e+00   , 2.000000e+00   , 3.367067e-01   , 8.907810e+00   , -2.548819e-04  , -2.789738e-04  ,

# MLS SIFs at Crack Propagation Step: 0

# MLS approximation:
# Sample, t,             NA,             NA,              K_I,            K_II,           K_III,
# Crack front stretch: 0
  0      , 0.000000e+00   , 0.000000e+00   , 0.000000e+00   , 8.446880e+00   , -1.360875e-03  , -1.137681e-04-1.360875e-03  ,
  1      , 5.670333e-02   , 0.000000e+00   , 0.000000e+00   , 8.554168e+00   , -1.156931e-03  , -1.609628e-04  ,
  2      , 1.134067e-01   , 0.000000e+00   , 0.000000e+00   , 8.648241e+00   , -9.755573e-04  , -1.981679e-04  ,

# more comments
  more comments
# more comments

# Raw SIFs at Crack Propagation Step: 1
# Vertex, X,              Y,              Z,              K_I,            K_II,           K_III,
  0      , 2.186139e+00   , 2.000000e+00   , -1.688418e-03  , 0.000000e+00   , 0.000000e+00   , 0.000000e+00   ,
  1      , 2.192003e+00   , 2.000000e+00   , 1.646902e-01   , 9.571022e+00   , 4.770358e-03   , -7.809699e-03  ,
  2      , 2.196234e+00   , 2.000000e+00   , 3.319183e-01   , 9.693934e+00   , -9.634989e-03  , -4.455937e-03  ,

# MLS SIFs at Crack Propagation Step: 1

# MLS approximation:
# Sample, t,             NA,             NA,              K_I,            K_II,           K_III,
# Crack front stretch: 0
   0      , 0.000000e+00   , 0.000000e+00   , 0.000000e+00   , 9.402031e+00   , 2.097959e-02   , -1.066071e-02  ,
   1      , 5.546786e-02   , 0.000000e+00   , 0.000000e+00   , 9.467541e+00   , 1.443546e-02   , -9.256367e-03  ,
   2      , 1.109357e-01   , 0.000000e+00   , 0.000000e+00   , 9.525021e+00   , 8.554051e-03   , -8.001627e-03  ,
As you can see, the lines without the # symbol contains the data I would like to plot. I've only shown you a short portion of step 0 and step 1, but there are around 20 steps in this file. And in each step, there are two types of data: RAW SIFS and MLS SIFS. In the Python GUI, I would like to give the inputter several options on how they want the graphs to look like:
1) Raw, MLS, or both?
2) What steps do they want to see on the graph? (ex. odd steps [1,3,5...], block steps [ like 1-5, 6-10, 11-15...], etc.)
3) If they want RAW SIFS, what values do they want for the x-axis (vertex, X, Y, or Z)?
4) Have KI, KII, and KIII in one graph; in 3 seperate graphs; or other combinations?
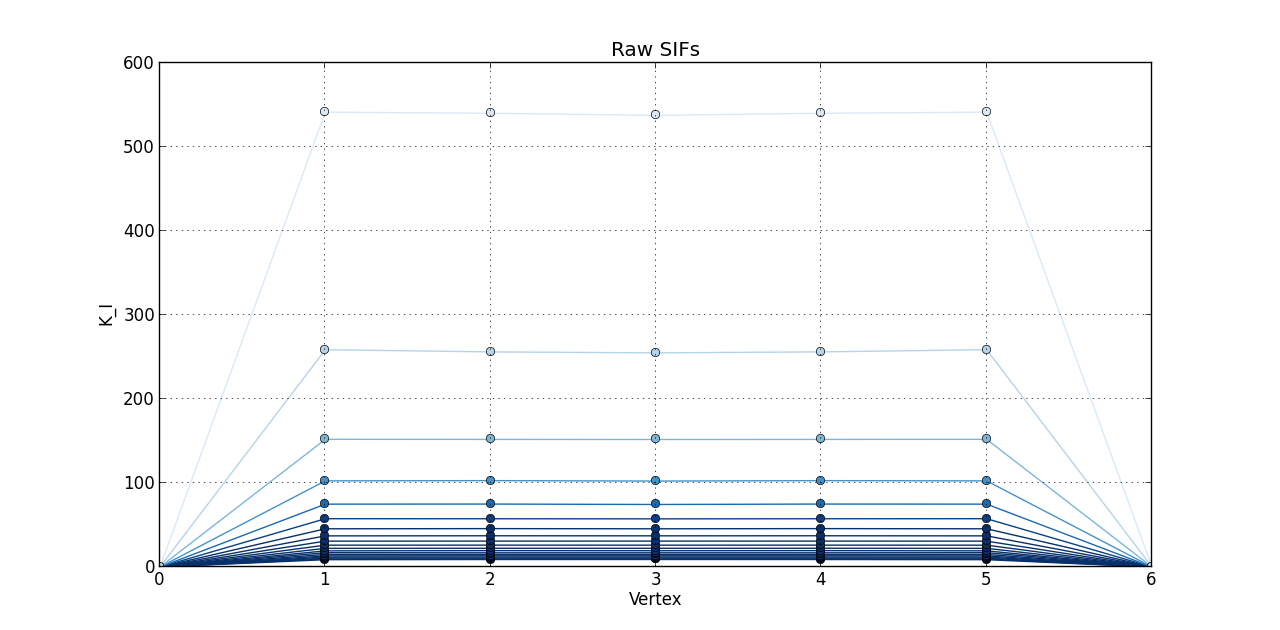
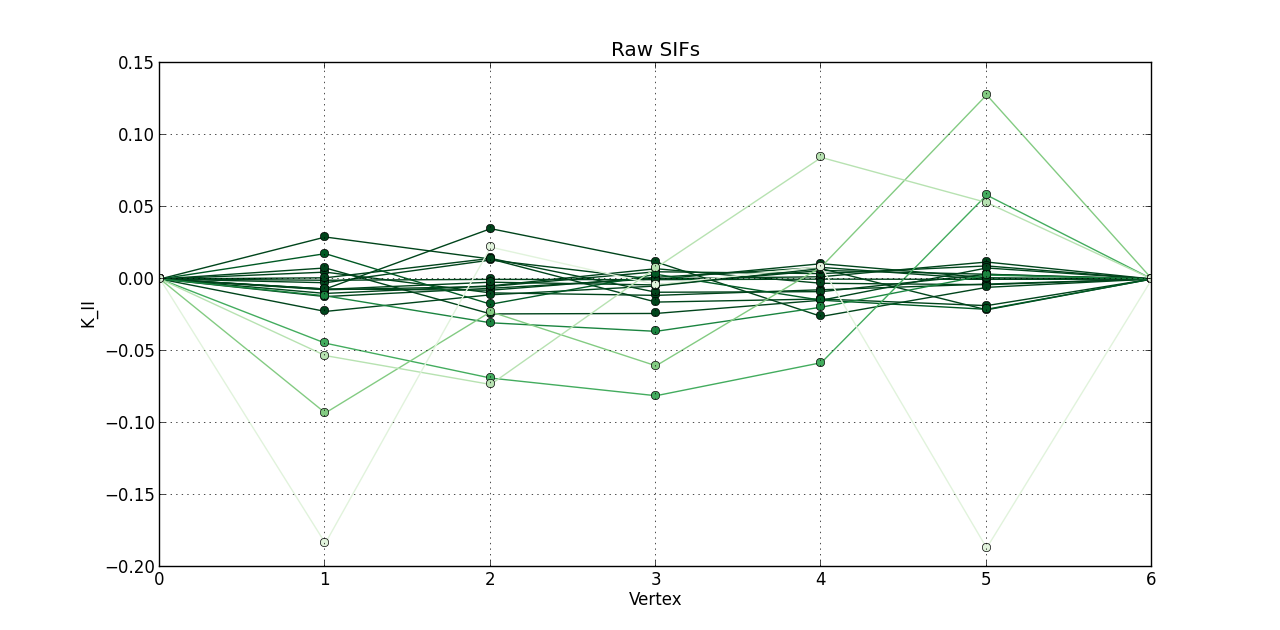
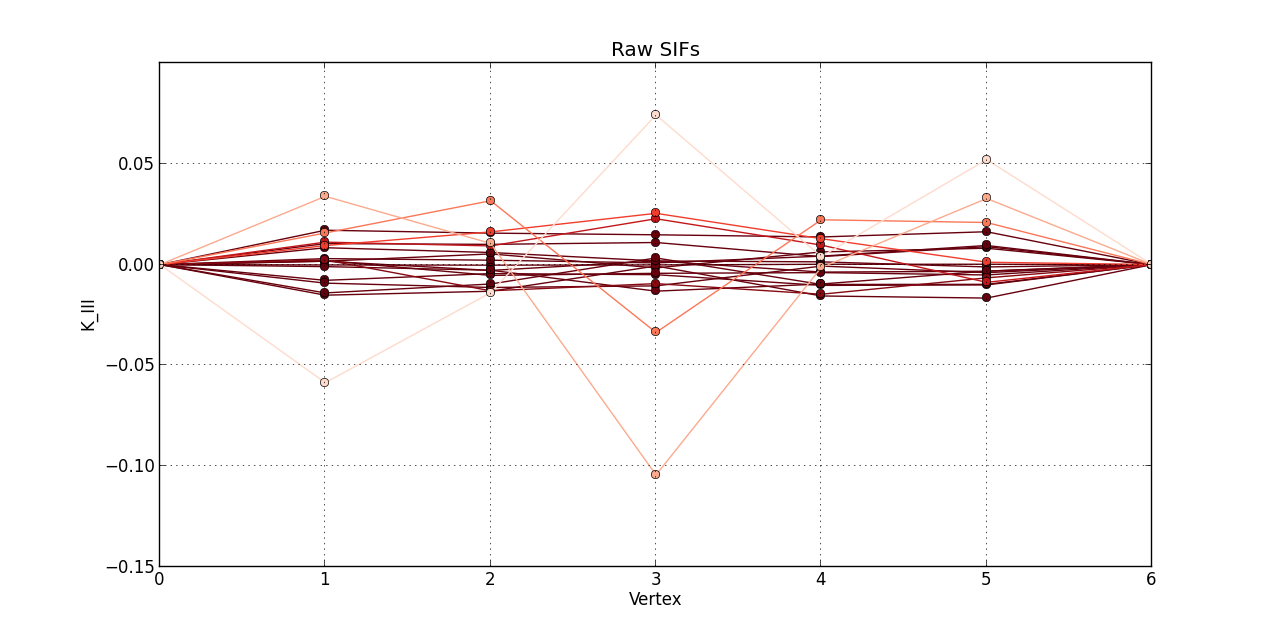
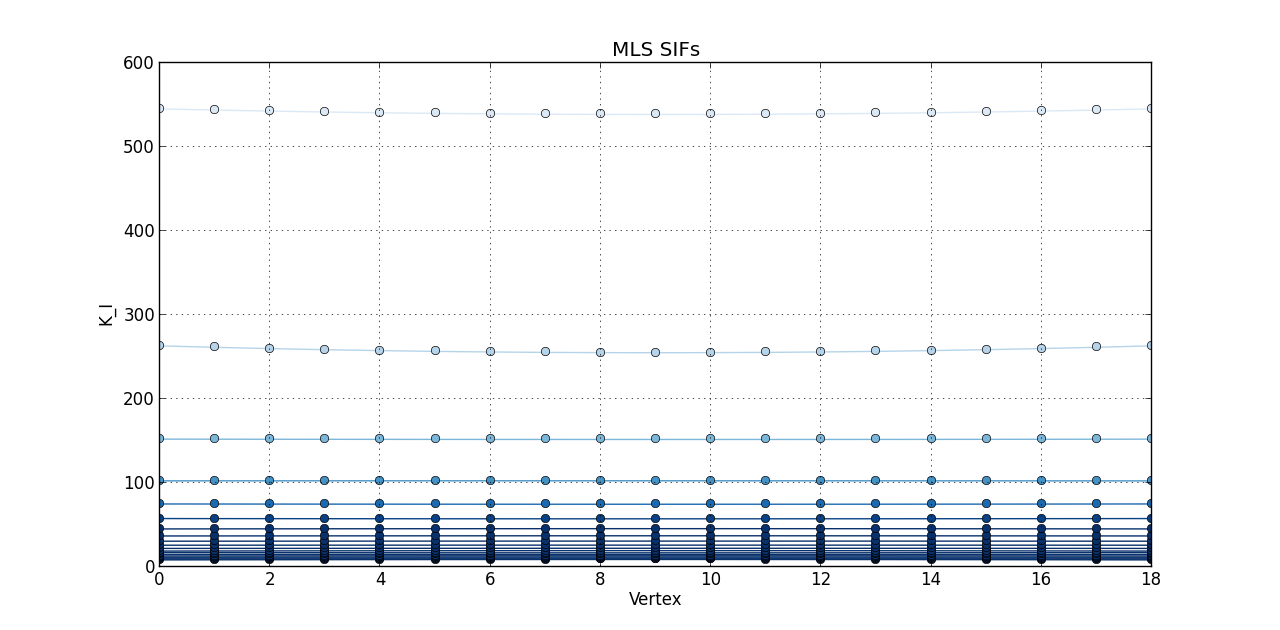
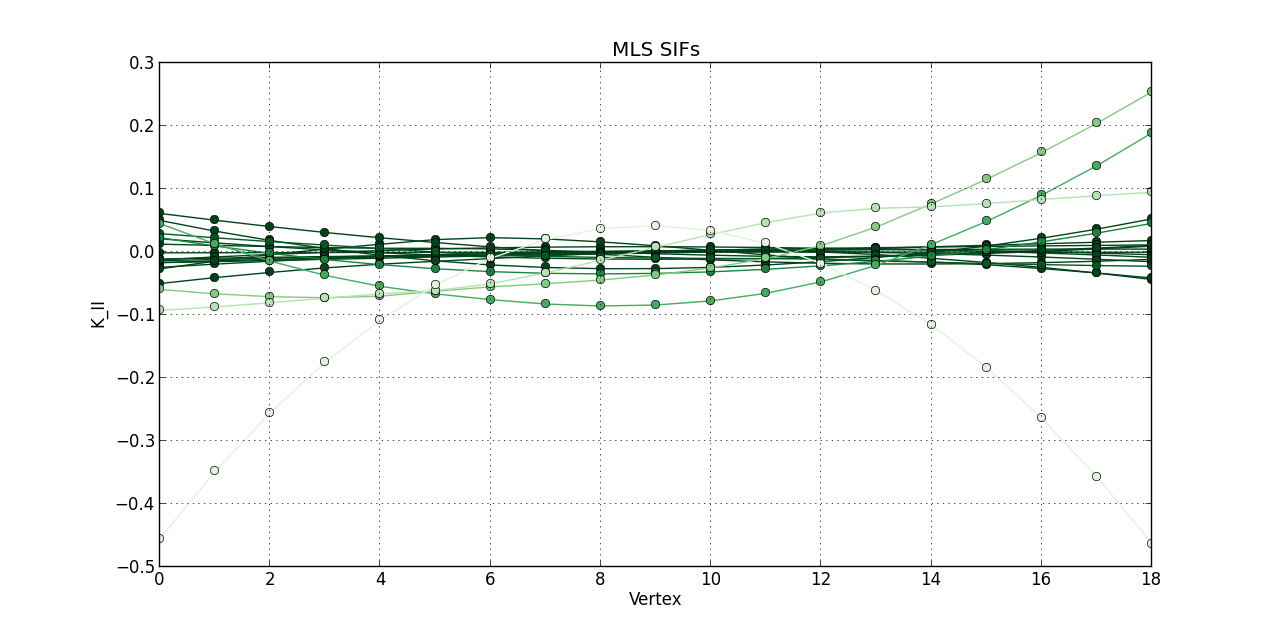
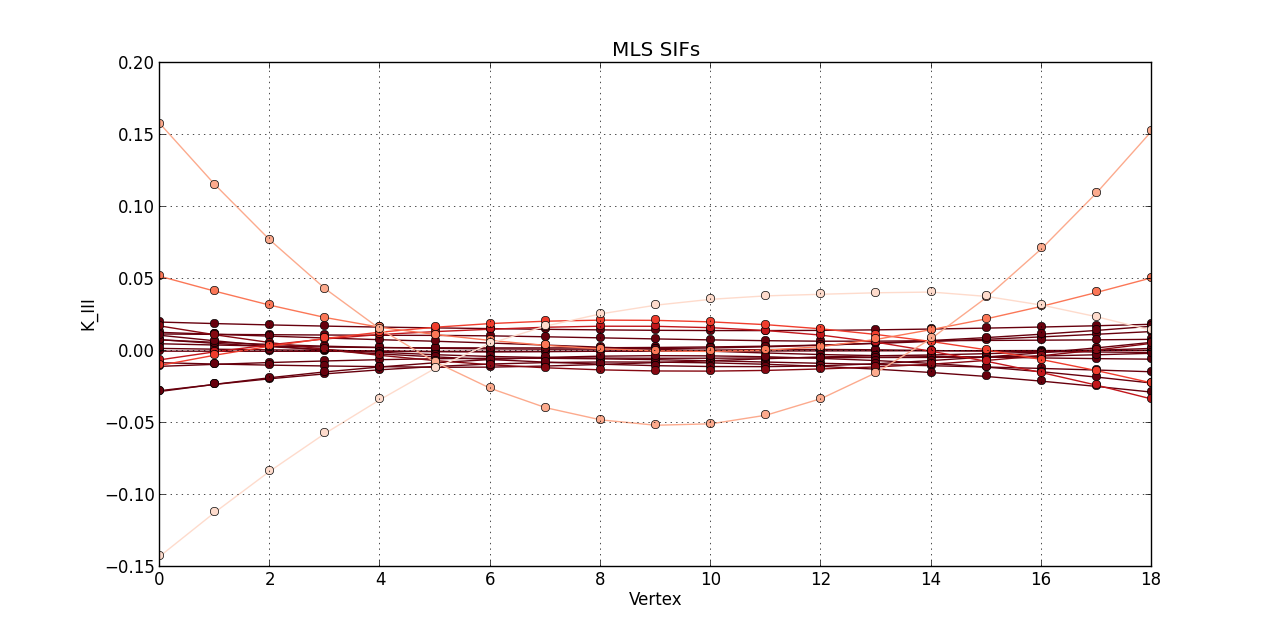
So far, I plotted a line graph of: vertex (1st column) versus K_I (5th column), vertex (1st column) versus K_II (6th column), and vertex (1st column) versus K_III (7th kevin). In the end, I plotted the 20 steps of RAW SIFS for vertex vs K_I with 20 curves all in one graph. Then, another graph of the 20 steps of RAW SIFS for vertex vs K_II, and another one for K_III. Similarly, I plotted the 20 steps of **MLS SIFS **for vertex vs K_I with 20 curves all in one graph. Then, another graph of the 20 steps of **MLS SIFS **for vertex vs K_II, and another one for K_III. I also incuded lightening shades of color for each graph.
Here is the code I written so far:
# helper function to parse a data block
def parse_SIF(lines):
    SIF = []
    while lines:
        line = lines.pop(0).lstrip()
        if line == '' or line.startswith('#') or line.startswith('[-1.000000e+00'):
            if line.startswith('# Raw SIFs at') or line.startswith('# MLS SIFs at'):
                lines.insert(0, line)
                break
            continue
        data = line.split(',')
        # pick only columns 0, 4, 5, 6 and
        # convert to appropiate numeric format
        # and append to list for current SIF and step
        SIF.append([int(data[0]), float(data[4]), float(data[5]), float(data[6])])
    return SIF

# your global data structure - nested lists
raw = []
mls = []

# read whole file into one list - ok if data is not large
with open('C:\Users\Documents\edge_cracked_crack_propag_3D_hpGFEM_mesh_11x11x3.crp') as fptr:
    lines = fptr.readlines()

# global parse routine - call helper function to parse data blocks
while lines:
    line = lines.pop(0)
    if line.startswith('#'):
        if line.find('Raw SIFs at Crack Propagation Step:') > -1:
            raw.append(parse_SIF(lines))
        if line.find('MLS SIFs at Crack Propagation Step:') > -1:
            mls.append(parse_SIF(lines))

# show results for data
#from pprint import pprint
#for raw_step, mls_step in zip(raw, mls):
#    print 'raw:'
#    pprint(raw_step)
#    print 'mls:'
#    pprint(mls_step)

from pylab import *
import matplotlib.pyplot as plt

blues = plt.get_cmap('Blues') # this returns a colormap
reds = plt.get_cmap('Reds')
greens = plt.get_cmap('Greens')

for i, raw_step in enumerate(raw):
    raw_step = zip(*raw_step)
    Raw_Vertex, Raw_KI, Raw_KII, Raw_KIII = raw_step[0], raw_step[1], raw_step[2], raw_step[3]

    figure(1)
    plot(Raw_Vertex, Raw_KI, 'o-', color = blues(3*(1 - float(i)/(len(raw)-0.1)))) # blues(x) returns a color for each x between 0.0 and 1.0
    grid(True)
    title('Raw SIFs')
    xlabel('Vertex')
    ylabel('K_I')

    figure(2)
    plot(Raw_Vertex, Raw_KII, 'o-', color = greens(3*(1 - float(i)/(len(raw)-0.1))))
    grid(True)
    title('Raw SIFs')
    xlabel('Vertex')
    ylabel('K_II')

    figure(3)
    plot(Raw_Vertex, Raw_KIII, 'o-', color = reds(3*(1 - float(i)/(len(raw)-0.1))))
    grid(True)
    title('Raw SIFs')
    xlabel('Vertex')
    ylabel('K_III')

show()


for i, mls_step in enumerate(mls):
    mls_step = zip(*mls_step)
    MLS_Vertex, MLS_KI, MLS_KII, MLS_KIII = mls_step[0], mls_step[1], mls_step[2], mls_step[3]

    figure(4)
    plot(MLS_Vertex, MLS_KI, 'o-', color = blues(3*(1 - float(i)/(len(mls)-0.1))))
    grid(True)
    title('MLS SIFs')
    xlabel('Vertex')
    ylabel('K_I')

    figure(5)
    plot(MLS_Vertex, MLS_KII, 'o-', color = greens(3*(1 - float(i)/(len(mls)-0.1))))
    grid(True)
    title('MLS SIFs')
    xlabel('Vertex')
    ylabel('K_II')

    figure(6)
    plot(MLS_Vertex, MLS_KIII, 'o-', color = reds(3*(1 - float(i)/(len(mls)-0.1))))
    grid(True)
    title('MLS SIFs')
    xlabel('Vertex')
    ylabel('K_III')

show()
Pictures of the 6 graphs are here:
How do I go about writing the code to give inputters those 4 options and then plotting what they want? Any help is greatly appreciated!
