OK, weird, I'm not sure how it calculated a '6' there. I'll see if I can find a better function for the week of the month.

EDIT: I found several, but they all seem to have one flaw or another. This one looks like the best I've found so far.

def week_number_of_month(date):
    """ Compute which week of the month a given date is in. 
    Taken from the page at
    https://stackoverflow.com/a/34297954/727708."""
    first_day = date.replace(day=1)
    day_of_month = date.day
    if(first_day.weekday() == 6):
         adjusted_dom = (1 + first_day.weekday()) / 7
    else:
         adjusted_dom = day_of_month + first_day.weekday()
    return int(ceil(adjusted_dom/7.0))
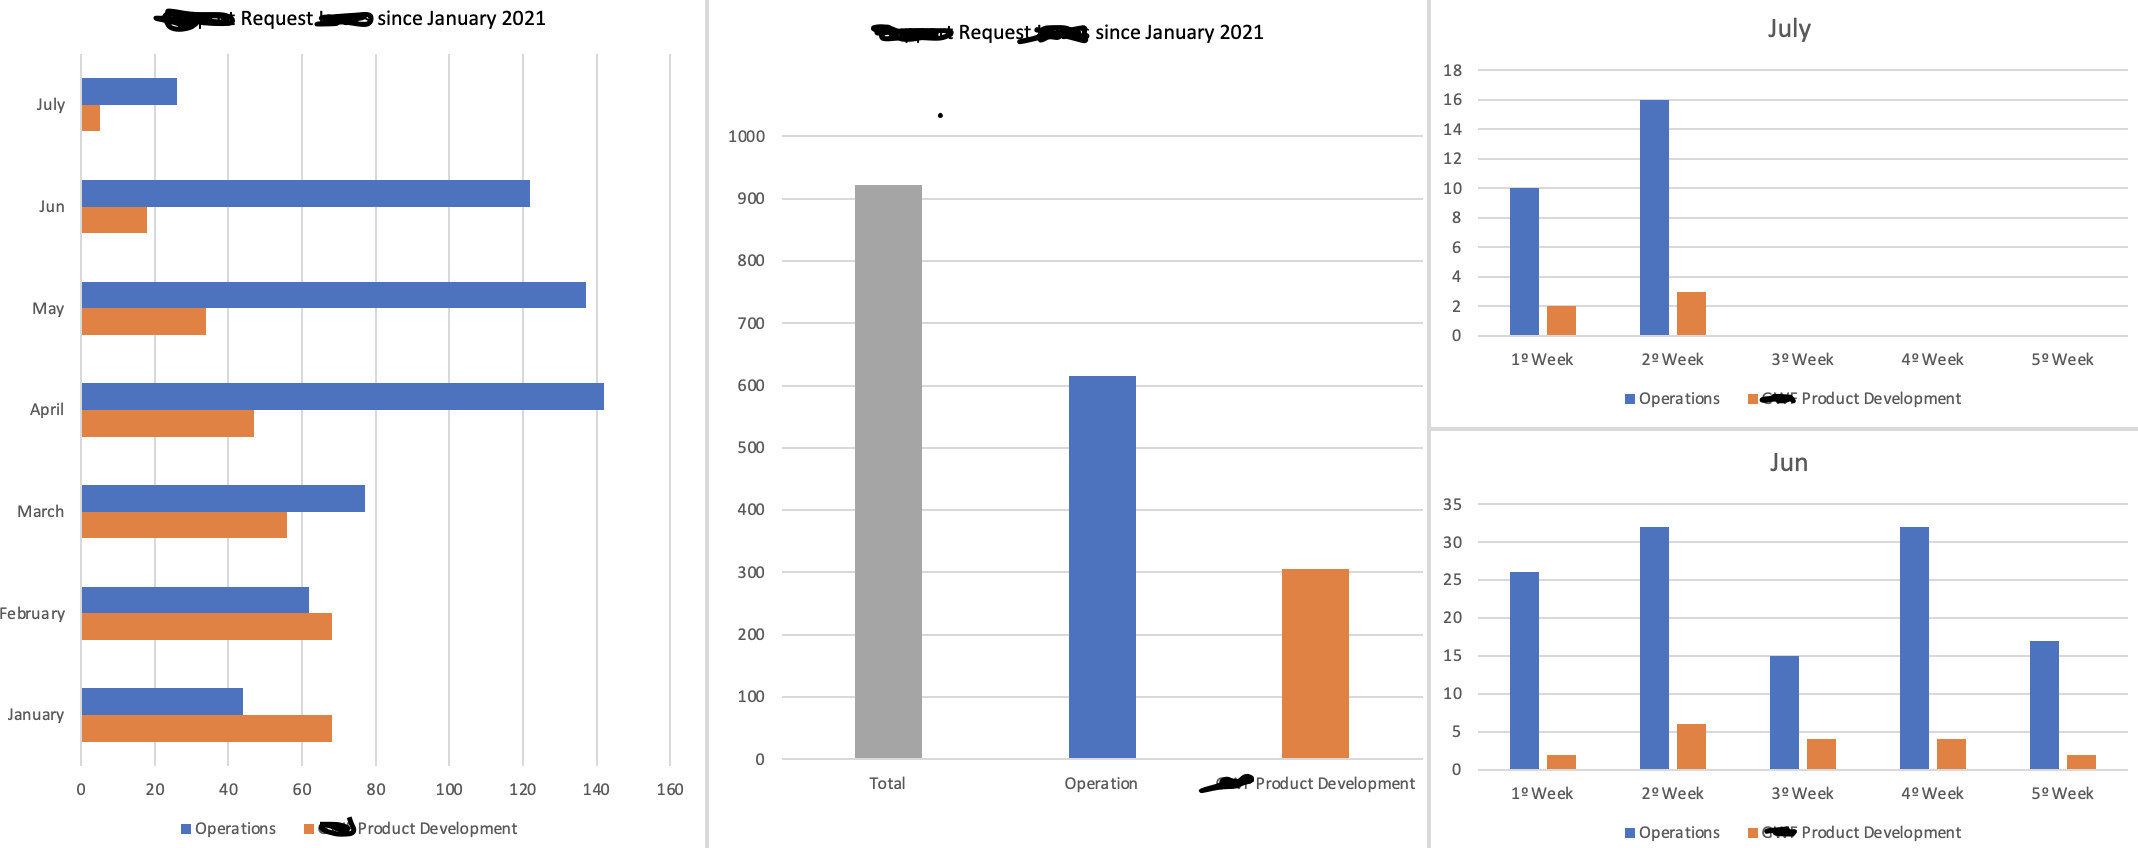
although that didnt work either the thing is that its not needed since what i need is current month, last month, total since the begining of the year and monthly from the begining of the year(you can see last week example bellow).

tipo = issue.fields.project.name.strip() existe because there are two option Operations and Product

i need it to make the distincion between project.name

something like this

    if "Operations" in str(issue.fields.project.name):
                tipo_operation += 1
            elif "Product Development" in str(issue.fields.project.name):

            tipo_product_development += 1

the problem im facing is spliting the month in weeks

also i need to generate all 4 graphic together like the picture bellow, cant see if that is possible :s

este.png

thank you for all the time you been helping me out, really apreciate it

OK, I am digging into matplotlib.figure to see what would allow you to do that.

I am going to try to get the multiple-subbar charts figured first. This page seems to be a place to start, though I am also going to dig further into the official documentation.

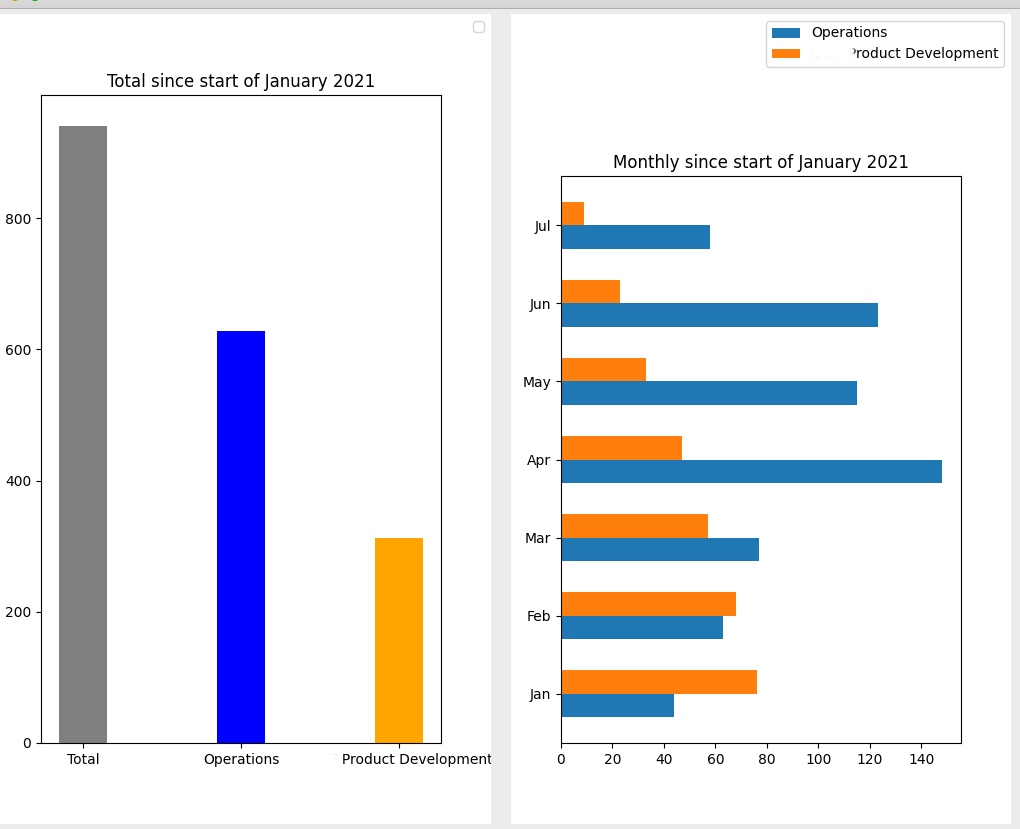
I got the simplest of the three types of chart done, and found a way to incorporate it into the the window as you say you need it.

def get_summary_chart(root, jsearch, start_date):
    """ Generates a Matplotlib bar chart window from the list of JIRA issues."""
    if len(jsearch) == 0:
        return
    issue_details = dict()
    colorset = ['gray', 'blue', 'orange', 'red', 'yellow', 'green', 'cyan', 'violet', 'purple', 'black', 'white']
    labels = ["Total"]   # initialize the list with the one element certain to be present
    # total is known from the size of the issues list
    issue_details["total"] = len(jsearch)
    # get the number of issues for each type
    for issue in jsearch:
        tipo = issue.fields.project.name.strip()
        if tipo not in issue_details.keys():
            labels.append(tipo)
            issue_details[tipo] = 1
        else:
            issue_details[tipo] += 1
    print(labels)
    data = [issue_details[issue_type] for issue_type in issue_details.keys()]
    fig = Figure(figsize=(6,5))
    axes = fig.add_axes([0.1, 0.1, 0.8, 0.8],
                        xticks=range(len(labels)),
                        xticklabels=labels, 
                        title='xxx Request yyy since start of {}'.format(start_date.strftime("%B %Y")))
    bar_width = 0.4
    bars = axes.bar(range(len(issue_details.keys())), data, width=bar_width, color=colorset)
    return fig

This is used as such:

figure = FigureCanvasTkAgg(get_summary_chart(frm, jsearch_all_year, year_start), master=frm)

I am working on the monthly breakdown chart, and figuring out how to place the generated charts somewhere other than the top of the window.

Another function for generating another chart, this time the cumulative operations by month. Note that I haven't figured out how to move the legend yet.

def get_annual_breakdown_chart(root, jsearch, start_date, end_date):
    """ Generates a Matplotlib bar chart window from the list of JIRA issues."""
    if len(jsearch) == 0:
        return
    issue_details = dict()
    colorset = ['blue', 'orange', 'red', 'yellow','magenta', 'green', 'cyan', 'violet', 'purple', 'black', 'white', 'gray']
    labels = list()
    next_month = start_date
    for m in range(0, end_date.month):
        labels.append(next_month.strftime("%b"))
        next_month = next_month.replace(month=next_month.month+1)
    index = np.arange(len(labels))
    issue_types = list()
    monthly_counts = [dict() for x in index] 
    # get the number of issues for each type
    for issue in jsearch:
        tipo = issue.fields.project.name.strip()
        datef = issue.fields.created.strip()
        issue_month = parse(datef).month
        # add type to the list of known issue types
        if tipo not in issue_types:
            issue_types.append(tipo)
            for month in monthly_counts:
                month[tipo] = 0
        # increment the count for the issue type for the given month
        monthly_counts[issue_month-1][tipo] += 1

    fig = Figure(figsize=(6,5))
    bar_height = 0.3
    axes = fig.add_axes([0.1, 0.1, 0.8, 0.7],
                        yticks=(index+(bar_height/len(issue_types))),
                        yticklabels=labels,
                        title='xxx Request yyy since start of {}'.format(start_date.strftime("%B %Y")))
    # flatten the data to a form axes.barh() can use
    data = list()
    for i, issue in enumerate(issue_types):
        data.append(list())
        for month in monthly_counts:
            data[i].append(month[issue])
    bars = list()
    for i in range(len(issue_types)):
        bars.append(axes.barh(index+(bar_height*i), data[i], bar_height, label=issue_types[i]))

    fig.legend()
    return fig 

You can run both of these together with the following code:

    figures = list()
    figures.append(FigureCanvasTkAgg(get_annual_breakdown_chart(frm, jsearch_all_year, year_start, todays_date), master=frm))
    figures.append(FigureCanvasTkAgg(get_summary_chart(frm, jsearch_all_year, year_start), master=frm))
#    figures.append(FigureCanvasTkAgg(get_monthly_chart(frm, jsearch_last_month, last_month), master=frm)
#    figures.append(FigureCanvasTkAgg(get_monthly_chart(frm, jsearch_current_month, current_month), master=frm)

    for i,f in (enumerate(figures)): 
        f.draw()
        f.get_tk_widget().grid(column=(i*2), row=10, padx=10, pady=5)

This is as close as I think I can come to the design document. Hope this helps.

import calendar
from math import ceil
import numpy as np
import matplotlib.pyplot as plt
from matplotlib.figure import Figure
from matplotlib.backends.backend_tkagg import (FigureCanvasTkAgg, 
NavigationToolbar2Tk)
from datetime import datetime, timedelta
from dateutil.parser import *
from tkinter import Tk, Button, ttk, Label, CENTER, RIGHT, LEFT, W
from jira import JIRA
import tkinter as tk
import numpy as np
import matplotlib.pyplot as plt
import calendar

class MockProject:
    def __init__(self, name):
        self.name = name

class MockFields:
    def __init__(self, project_name, created_date):
        self.project = MockProject(project_name)
        self.created = created_date

class MockIssue:
    def __init__(self, project_name, created_date):
        self.fields = MockFields(project_name, created_date) 

def get_issues(live=True):
    """ Get a set of JIRA issues for a given time period.
        For testing purposes, it can instead get data from 
        a data file 'sample.txt' and mocking up the JIRA
        issue data structure."""
    jsearch_all_year = list()
    jsearch_current_month = list()
    jsearch_last_month = list()
    if live:
        serverURL = 'https://jira.mob.dev/'
        user = 'user'
        password = 'pass'
        options = {'server': serverURL}
        jira = JIRA(options, basic_auth=(user, password))

        projapesquisar = "(GPD, OP)"
        utlapesquisar = str(["user{}".format(x) for x in range(1, 7)]).replace('[','(').replace(']',')')

        jsearch_current_month = jsearch_by(jira, projapesquisar, utlapesquisar, current_month, dt, start, size)
        jsearch_last_month = jsearch_by(jira, projapesquisar, utlapesquisar, last_month, current_month, start, size)
        jsearch_all_year = jsearch_by(jira, projapesquisar, utlapesquisar, year_start, dt, start, size)
    else:
        file = open("sample.txt")
        data_lines = file.readlines()
        for data_line in data_lines:
            tipo, date = data_line.split('<->')
            tipo = tipo.strip()
            date = date.strip()
            if date == 'Date':
                # skip the first line with the labels fo the columns
                continue
            # create a mocked issue
            issue = MockIssue(tipo, date)
            issue_date = datetime.strptime(date.strip(), '%Y-%m-%dT%H:%M:%S.%f%z')
            # accumulate issues for previous month
            if (issue_date.year == last_month.year) and (issue_date.month == last_month.month):
                jsearch_last_month.append(issue)
            # accumulate issues for current month
            elif (issue_date.year == current_month.year) and (issue_date.month == current_month.month):
                jsearch_current_month.append(issue)
            else:
                pass
            # accumulate all issues for the year
            if issue_date.year == year_start.year:
                jsearch_all_year.append(issue)
    return jsearch_last_month, jsearch_current_month, jsearch_all_year

def display_calendar(root, calendar, month, row, column):
    Label(root, text=month.strftime("%B"), justify=CENTER, anchor="e", font=('Consolas', 16, 'bold')).grid(row=row, column=column, sticky=W, pady=1)
    for x, days in enumerate(calendar.monthdayscalendar(month.year, month.month)):
        w = ''
        for day in days:
            if day == 0:
                w += '   '
            else:
                w += '{day: 3}'.format(day=day)
        Label(root, text="Week {0}: ".format(x+1), justify=RIGHT, anchor="e",font=('Consolas', 12, 'bold')).grid(row=x+row+1, column=column, sticky=W, pady=1)
        Label(root, text="{0}".format(w), justify=RIGHT, anchor="e",font=('Consolas', 12, 'bold')).grid(row=x+row+1, column=column+1, sticky=W, pady=1)


def get_monthly_chart(root, jsearch, month):
    """ Generates a Matplotlib bar chart window from the list of JIRA issues."""
    if len(jsearch) == 0:
        return
    issue_details = dict()
    issue_types = list()
    labels = ["Week {}".format(i) for i in range(1, 6)]
    index = np.arange(len(labels))
    issue_types = list()
    weekly_counts = [dict() for x in index] 
    # get the number of issues for each type
    for issue in jsearch:
        tipo = issue.fields.project.name.strip()
        datef = issue.fields.created.strip()
        issue_week = week_number_of_month(parse(datef))
        # add type to the list of known issue types
        if tipo not in issue_types:
            issue_types.append(tipo)
            for week in weekly_counts:
                week[tipo] = 0
        # increment the count for the issue type for the given month
        weekly_counts[issue_week-1][tipo] += 1
    labels = ["Week {}".format(x) for x in range(1,6)]
    index = np.arange(len(labels))
    fig = Figure(figsize=(6,5))
    bar_width = 0.3
    axes = fig.add_axes([0.1, 0.1, 0.8, 0.7],
                        xticks=(index+(bar_width/len(issue_types))),
                        xticklabels=labels,
                        title=month.strftime("%B"))
    sub_bars = len(issue_types)
    sub_bar_width = bar_width / sub_bars
    # flatten the data to a form axes.barh() can use
    data = list()
    for i, issue in enumerate(issue_types):
        data.append(list())
        for week in weekly_counts:
            data[i].append(week[issue])
    bars = list()
    for i, tipo in enumerate(issue_types):
        bars.append(axes.bar(index+(sub_bar_width*i), data[i], width=sub_bar_width, label=issue_types[i]))

    fig.legend()
    return fig


def get_summary_chart(root, jsearch, start_date):
    """ Generates a Matplotlib bar chart window from the list of JIRA issues."""
    if len(jsearch) == 0:
        return
    issue_details = dict()
    colorset = ['gray', 'blue', 'orange', 'red', 'yellow', 'green', 'cyan', 'violet', 'purple', 'black', 'white']
    labels = ["Total"]   # initialize the list with the one element certain to be present
    # total is known from the size of the issues list
    issue_details["total"] = len(jsearch)
    # get the number of issues for each type
    for issue in jsearch:
        tipo = issue.fields.project.name.strip()
        if tipo not in issue_details.keys():
            labels.append(tipo)
            issue_details[tipo] = 1
        else:
            issue_details[tipo] += 1
    data = [issue_details[issue_type] for issue_type in issue_details.keys()]
    fig = Figure(figsize=(5, 8))
    axes = fig.add_axes([0.1, 0.1, 0.8, 0.8],
                        xticks=range(len(labels)),
                        xticklabels=labels, 
                        title='xxx Request yyy since start of {}'.format(start_date.strftime("%B %Y")))
    bar_width = 0.4
    bars = axes.bar(range(len(issue_details.keys())), data, width=bar_width, color=colorset)
    return fig    


def get_annual_breakdown_chart(root, jsearch, start_date, end_date):
    """ Generates a Matplotlib bar chart window from the list of JIRA issues."""
    if len(jsearch) == 0:
        return
    colorset = ['blue', 'orange', 'red', 'yellow','magenta', 'green', 'cyan', 'violet', 'purple', 'black', 'white', 'gray']
    labels = list()
    next_month = start_date
    for m in range(0, end_date.month):
        labels.append(next_month.strftime("%b"))
        next_month = next_month.replace(month=next_month.month+1)
    index = np.arange(len(labels))
    issue_types = list()
    monthly_counts = [dict() for x in index] 
    # get the number of issues for each type
    for issue in jsearch:
        tipo = issue.fields.project.name.strip()
        datef = issue.fields.created.strip()
        issue_month = parse(datef).month
        # add type to the list of known issue types
        if tipo not in issue_types:
            issue_types.append(tipo)
            for month in monthly_counts:
                month[tipo] = 0
        # increment the count for the issue type for the given month
        monthly_counts[issue_month-1][tipo] += 1

    fig = Figure(figsize=(5, 8))
    bar_height = 0.3
    axes = fig.add_axes([0.1, 0.1, 0.8, 0.7],
                        yticks=(index+(bar_height/len(issue_types))),
                        yticklabels=labels,
                        title='xxx Request yyy since start of {}'.format(start_date.strftime("%B %Y")))
    # flatten the data to a form axes.barh() can use
    data = list()
    for i, issue in enumerate(issue_types):
        data.append(list())
        for month in monthly_counts:
            data[i].append(month[issue])
    bars = list()
    for i in range(len(issue_types)):
        bars.append(axes.barh(index+(bar_height*i), data[i], bar_height, label=issue_types[i]))

    fig.legend()
    return fig    


def prev_month(date):
    """ Returns a Datetime for the first day of the previous month.
        This is necessary to avoid underflowing on January;
        it checks for the beginning of the year and returns
        December of the previous year if the current month 
        is January."""
    if date.month == 1:
        return date.replace(month=12, year=date.year-1, day=1)
    else:
        return date.replace(month=date.month-1, day=1)

def jsearch_by(jira, projects, users, start_date, end_date, start, size):
    """ Submits a query to the JIRA server and returns the results."""
    source_query = 'project in {projects} AND creator in {users}'.format(projects=projects, users=users)
    date_query = 'AND created >= {start} AND created < {end}'.format(start=start_date.strftime("%Y-%m-01"), end=end_date.strftime("%Y-%m-%d"))
    query = "{}{}".format(source_query, date_query)
    return jira.search_issues(query, start, size)

#def week_number_of_month(date_value):
#    """ Compute which week of the month a given date is in. 
#    Taken from the page at https://www.mytecbits.com/internet/python/week-number-of-month."""
#    ret_date = date_value.isocalendar()[1] - date_value.replace(day=1).isocalendar()[1] + 1
#    if ret_date >= 1:
#        return ret_date
#    else:
#        return 5

def week_number_of_month(date):
    """ Compute which week of the month a given date is in. 
    Taken from the page at
    https://stackoverflow.com/a/34297954/727708."""
    first_day = date.replace(day=1)
    day_of_month = date.day
    if(first_day.weekday() == 6):
         adjusted_dom = (1 + first_day.weekday()) / 7
    else:
         adjusted_dom = day_of_month + first_day.weekday()
    return int(ceil(adjusted_dom/7.0))


def week_number_of_year(date_value):
    """ Compute which week of the month a given date is in. 
    Taken from the page at https://www.mytecbits.com/internet/python/week-number-of-month."""
    return int(date_value.strftime("%W"))

def month_number_of_year(date_value):
    """ Compute the number and name of the month a date is in. 
    Taken from the page at https://www.mytecbits.com/internet/python/week-number-of-month."""
    return int(date_value.strftime("%m")), date_value.strftime("%B")

if __name__ == "__main__":
    root = Tk()
    w, h = root.winfo_screenwidth(), root.winfo_screenheight()
    root.geometry("{width}x{height}+0+0".format(width=w, height=h))
    root.title("week")

    todays_date = datetime.today()
    cd = calendar.Calendar()

    year_start = todays_date.replace(month=1, day=1)
    current_month =  todays_date.replace(day=1)
    last_month = prev_month(current_month)

    frm = ttk.Frame(root)
    frm.grid(column=0, row=0)

#    display_calendar(root, cd, last_month, 0, 2)
#    display_calendar(root, cd, current_month, 0, 4)

    jsearch_last_month, jsearch_current_month, jsearch_all_year = get_issues(False)

    figures = list()
    figures.append(FigureCanvasTkAgg(get_annual_breakdown_chart(frm, jsearch_all_year, year_start, todays_date), master=frm))
    figures.append(FigureCanvasTkAgg(get_summary_chart(frm, jsearch_all_year, year_start), master=frm))
    figures.append(FigureCanvasTkAgg(get_monthly_chart(frm, jsearch_last_month, last_month), master=frm))
    figures.append(FigureCanvasTkAgg(get_monthly_chart(frm, jsearch_current_month, current_month), master=frm))

    for i,f in (enumerate(figures)):
        if i == 3:
            row = 6
            col = 12
        else:
            row = 0
            col = i * 6
        if i == 2 or i == 3:
            rowspan = 5
        else:
            rowspan = 10
        f.get_tk_widget().grid(column=col, row=row, columnspan=6, rowspan=rowspan, padx=10, pady=5)
        f.draw()

    root.mainloop()

Wow thats is great, thank you so much.

had to make some changes but its working great.

Just two things, how can i had the subtitle to the first chart?

why are the colors diferent? iv check the code and its same but as you can see bellow the blue and orange are diferent ? :s

AAaaaaaaaa.png

I'm not sure what you mean by the subtitle, but I am assuming you mean the label for an axis as a whole. For the X axis (horizontal), that would be xlabel, while for the Y axis (vertical) it would be ylabel.

As for the color difference, I was puzzled by that myself. I honestly don't know why it looks different.

One thing I should add is that I wrote it so that it doesn't depend on a fixed number of issue types; if you need to add a new issue type in the future, it should be able to handle it as-is.

commented: but there isnt any ylabel or xlabel in the source :s ill dig in to this tomorow, thanks +2

You would add it to the add_axes() call, like so:

    axes = fig.add_axes([0.1, 0.1, 0.8, 0.8],
                        xticks=range(len(labels)),
                        xticklabels=labels,
                        xlabel="Issue Types",
                        title='xxx Request yyy since start of {}'.format(start_date.strftime("%B %Y")))

that only give the total, printed labels and it return all 3, but when applying to chart it only displays the first(Total)

added this

 for i in range(len(issue_details)):
        bars = axes.bar(range(len(issue_details.keys())), data, width=bar_width, color=colorset, label=labels[i])

and now it shows the legends but all in gray :s

tried to change color=colorset to color=colorset[i] and the legends color was right but the bars in the chart get all orange :s

fix the colors, dont ask me why but changed to more specific names and its ok now
colorset = ['SteelBlue', 'DarkOrange',

no one is ever happy at first :( now i need to add more projects but in the charts i will only use two, "operations" and all the others inside the name "others"

been trying with an if but its not working :s

if "Operations" not in tipo:
    tipo="Others"

if tipo not in issue_types:
    issue_types.append(tipo)

Can you help?
thanks

Try this instead:

         # force all issues other than "Operations" to "Other"
         if tipo != "Operations":
             tipo = "Other"
commented: it worked like my example, i seems to work fine but the data it sends is incomplete, maybe there was a problem migrating to the cloud server :( +3
Be a part of the DaniWeb community

We're a friendly, industry-focused community of developers, IT pros, digital marketers, and technology enthusiasts meeting, networking, learning, and sharing knowledge.