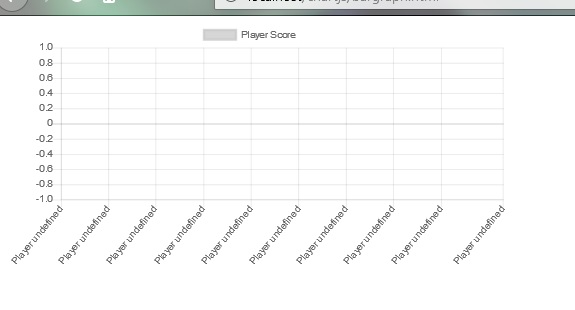
i want to show my graph values but its show null output. i show you in image output also

// JavaScript Document
$(document).ready(function(){
    $.ajax({
        url: "data.php",
        method: "GET",
        success: function(data) {
            console.log(data);
            var playerid = [];
            var score = [];

            for(var i in data) {
                playerid.push("Player " + data[i].playerid);
                score.push(data[i].score);
            }

            var chartdata = {
                labels: playerid,
                datasets : [
                    {
                        label: 'Player Score',
                        backgroundColor: 'rgba(200, 200, 200, 0.75)',
                        borderColor: 'rgba(200, 200, 200, 0.75)',
                        hoverBackgroundColor: 'rgba(200, 200, 200, 1)',
                        hoverBorderColor: 'rgba(200, 200, 200, 1)',
                        data: score
                    }
                ]
            };

            var ctx = $("#mycanvas");

            var barGraph = new Chart(ctx, {
                type: 'bar',
                data: chartdata
            });
        },
        error: function(data) {
            console.log(data);
        }
    });
});
Dani AI

Generated

As pointed out, this is JavaScript (fix the tags). The symptom you describe—bars showing "null"—almost always comes from the AJAX response or the types/shape of the data. Quick checklist to narrow it down: open DevTools → Network → inspect the response body for the request to data.php (should be a JSON array of objects), confirm HTTP 200, and check the Console for any parse errors. If the response is a string or the JSON structure doesn't match the property names you use, the chart arrays will end up with undefined/null values.

A minimal, reliable server output (PHP) should explicitly send JSON and numeric types:

<?php
header('Content-Type: application/json; charset=utf-8');
$mysqli = new mysqli('localhost','user','pass','db');
$res = $mysqli->query("SELECT id AS playerid, score FROM scores");
$out = [];
while ($r = $res->fetch_assoc()) {
    $out[] = [
        'playerid' => (int)$r['playerid'],
        'score'    => (float)$r['score']
    ];
}
echo json_encode($out);

On the client side, force JSON parsing, convert values to numbers, and pass a real canvas context to Chart.js:

$.getJSON('data.php')
  .done(function(resp) {
    var labels = resp.map(function(x){ return 'Player ' + x.playerid; });
    var values = resp.map(function(x){ return Number(x.score) || 0; });
    var ctx = document.getElementById('mycanvas').getContext('2d');
    new Chart(ctx, {
      type: 'bar',
      data: { labels: labels, datasets: [{ label: 'Player Score', data: values }] }
    });
  })
  .fail(function(jq, status, err){ console.error(status, err); });

Extra troubleshooting tips: log typeof resp and the arrays just before creating the chart; if the response is a string use JSON.parse; make sure the canvas ID matches and Chart.js is loaded before this code runs; and check for property-name mismatches (e.g., playerid vs player_id). These steps will find whether the problem is the server output, parsing, or the chart input data.

this is javascript, not java. You may want to update your tags, so it is shown in the correct subforum.

Be a part of the DaniWeb community

We're a friendly, industry-focused community of developers, IT pros, digital marketers, and technology enthusiasts meeting, networking, learning, and sharing knowledge.