1c1818c0424f995161e5d67c0832ee62

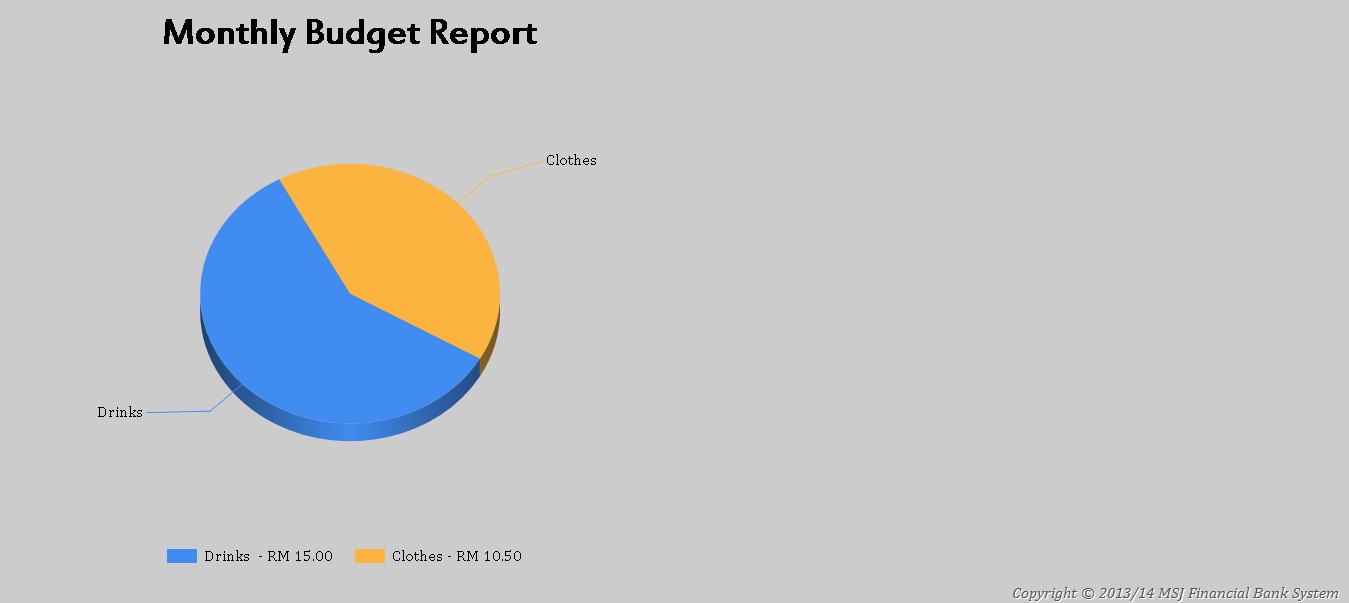
i want to create a dynamic data by showing the particular category details.
Example, if i mouse hover the area of clothes/the word of clothes, it pop out a new small window that showing another pie chart, how can i archieve that?
or showing the details in the right hand side by grouping the category which allow user to click "+" or "-" to expends or close the group.
Thanks for in advanced.

did you build that chart or is this just an example? Either way, what you are describing is going to have to be done client side.

Did you have something in mind or are you just collecting ideas?

I dont particularly care for the chart control in asp.net and I'm not sure you can use that alone to get all of that functionality you are describing.

In my mind i have 2 ideas. Either is mouse hover to display another sub window that showing another chart, like google search mouse hover at the link for few second and it will display another sub-window.
Or doing the "expand and enclose folder".

The purpose of doing this one is don't show messy data if the user's data has more than 100.

wow, so this needs to be built. I dont have anything handy to reference that i've done in a similar manner. Its interesting what you are saying but it would take time to build this, at least for me, unless you can find some open source chart that would work for you that you can extend the functionality in the way you described.

For charts, I've used Google Charts and HighCharts in the past, but for simple chart displaying.

No matter what chart it is, as long as can display when mouse hover.
What should i type the keyword to google search?
Interesting isn't it, one of friends suggested this way but i said it could be much more difficult to build due to time consume. :/

I'm not exactly sure how i'd implement this.. but my thoughts are to first focus on creating the chart. Then, once the chart is displayed and I can look at the HTML source, I can easily use javascript or even easier jQuery to show/hide other content on the same page. However, this may work for small amounts of data. For something really interactive, you need to dynamically update a table to show the relevant data.

You may want to take a look at this doc page from Google Charts... they have something similar to what you may be looking for. A pie chart with a table next to it that updates as you click on parts of the chart...

https://developers.google.com/chart/interactive/docs/gallery/controls

The web is helping me so much, Thanks for this. i would take some time to look through and try it. It any problem i will post a new thread again. Thanks JorgeM.

Be a part of the DaniWeb community

We're a friendly, industry-focused community of developers, IT pros, digital marketers, and technology enthusiasts meeting, networking, learning, and sharing knowledge.