Dear All,
I have a very long list of values as follow

(43, 560)
(516, 1533)
(1316, 3047)
(520, 1528)
(3563, 1316)
(45, 557)
(3562, 1312)
(2686, 1964)
(2424, 3340)
(3559, 1317)
(50, 561)
(2427, 3336)
(1313, 3046)
(3562, 1313)
(3559, 1318)
(2689, 1962)
(2429, 3339)
(3721, 2585)
(1317, 3048)

I would like to group values within a certain tolerance.
Say I set tolerance to 3, my 1st and 6th results ((43, 560) (45, 557)) should be grouped together in an average value: (44, 558.5).
What approach would be the best?
I really don't know where to start from. The only idea I got was the following.
I take each tuple of the initial list and add/subtract values from 1 to 3 (my tolerance), so the entry (43,560) will result in: (43,560),(42,559),(41,558),(40,557),(44,561),(45,562),(46,563).
I repeat this for all the entries of my initial list and take the values with most occurrences... but I am afraid this will just increase my list instead of reducing it and I am not sure I would get correct results.
As an addition, I tried to plot the values and got the following image
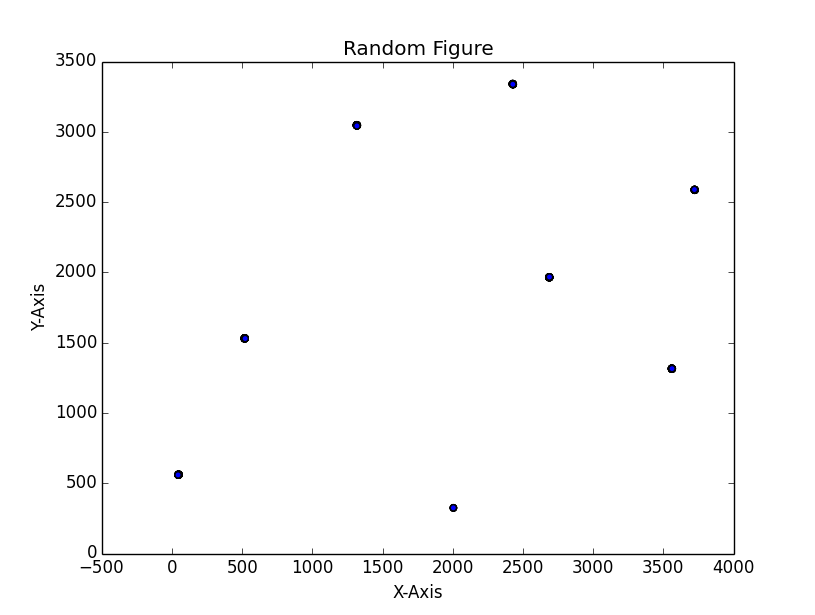
figure_1.png
but if I zoom in each cluster, I see something like this
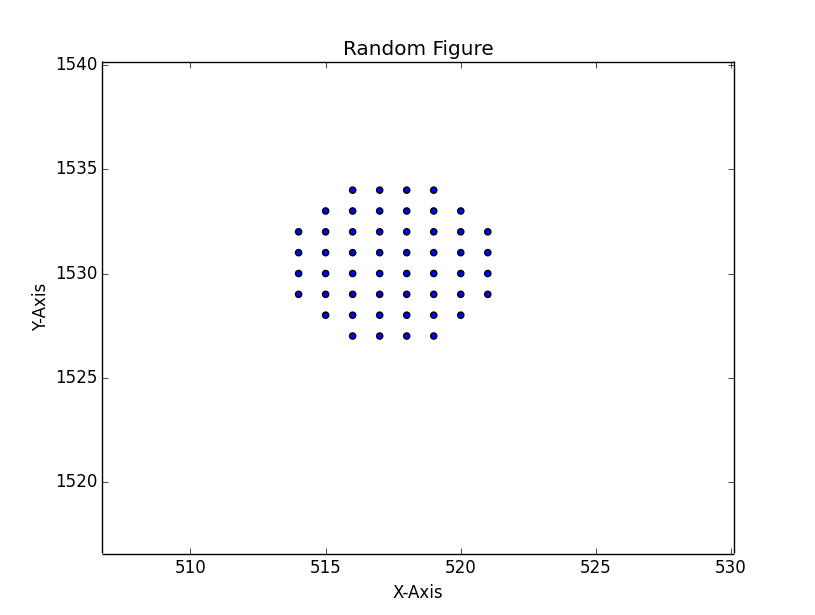
figure_2.png

I would like each cluster to become one single point (so in the end I have 8 x,y coordinates only).

Any help is much appreciated!
giancan

You could try to compute a key for each pair (x, y), the key could be (x//3, y//3) for a tolerance of 3. Then you sort the data by the key and you group together the points having the same key, using itertools.groupby(). You can then average the values in each group.

Thanks Gribouillis,
while waiting for some help I found another possible solution.

from cluster import KMeansClustering 
cl = KMeansClustering(unique_ptlist) #unique_ptlist is my starting point's list
clusters = cl.getclusters(8) 
filtered_list=[]

for subcluster in clusters:
    filtered_list.append(((sum(x[0] for x in subcluster))/len(subcluster),(sum(y[1] for y in subcluster))/len(subcluster))) # here I make the average of the coordinates in each sublist

The above seems to work fine. The only problem is that I have to enter manually the number of clusters I want and I have to find a way to solve this somehow.
How does it seem?

I don't know this cluster module. The number of clusters can probably be determined by

  • The shape of the clusters
  • Your tolerance
  • The minimum and maximum values of the coordinates

As I don't know the subcluster's shapes, I cannot give you a formula. You could perhaps draw the subclusters in different colors to see their shape and try to vary their numbers.

Or perhaps you could try

n = len(set((x//tol, y//tol) for (x, y) in data))

as a rough estimate of the number of clusters.

Maybe sort the list based on the first value. Then it's trivial to find consecutive entries that are within tolerance for the first value. For each set of such entries sort it by the second value and find the subsets that are within tolerance for the second value. Replace those subsets by their averages.

ps there are multiple solutions, and this may not find the optimum one (if "optimum" has been defined!).
Eg with 1, 3, 3, 5, 5, 5 ,5 the "best" solution could be to group all the 3s and 5s, but a single pass sequential algorithm may group the 1 and the 3s, then start a new group for the 5s

@JamesCherrill In your example my 'key' algorithm groups the 3s and the 5s in a one-liner because the keys x//3 for the values (1, 3, 3, 5 ,5, 5, 5) are (0, 1, 1, 1, 1, 1, 1). In python it gives

>>> import itertools as itt
>>> from functools import partial
>>> data = [1, 3, 3, 5, 5, 5, 5]
>>>
>>> def the_key(tol, val):
...     return val // tol
...
>>> print([the_key(3, x) for x in data] )
[0, 1, 1, 1, 1, 1, 1]
>>> print([list(g) for k, g in itt.groupby(data, partial(the_key, 3))])
[[1], [3, 3, 5, 5, 5, 5]]

The awesome part is that this works also with 2D data instead of 1D

Yes. My algorithm was 2d, just the illustration was 1d, and it extends to nD. But yours still looks a lot better :)
JC

ps what about 2,4,4,6,6,6,6 -> 1,1,1,2,2,2,2

Be a part of the DaniWeb community

We're a friendly, industry-focused community of developers, IT pros, digital marketers, and technology enthusiasts meeting, networking, learning, and sharing knowledge.