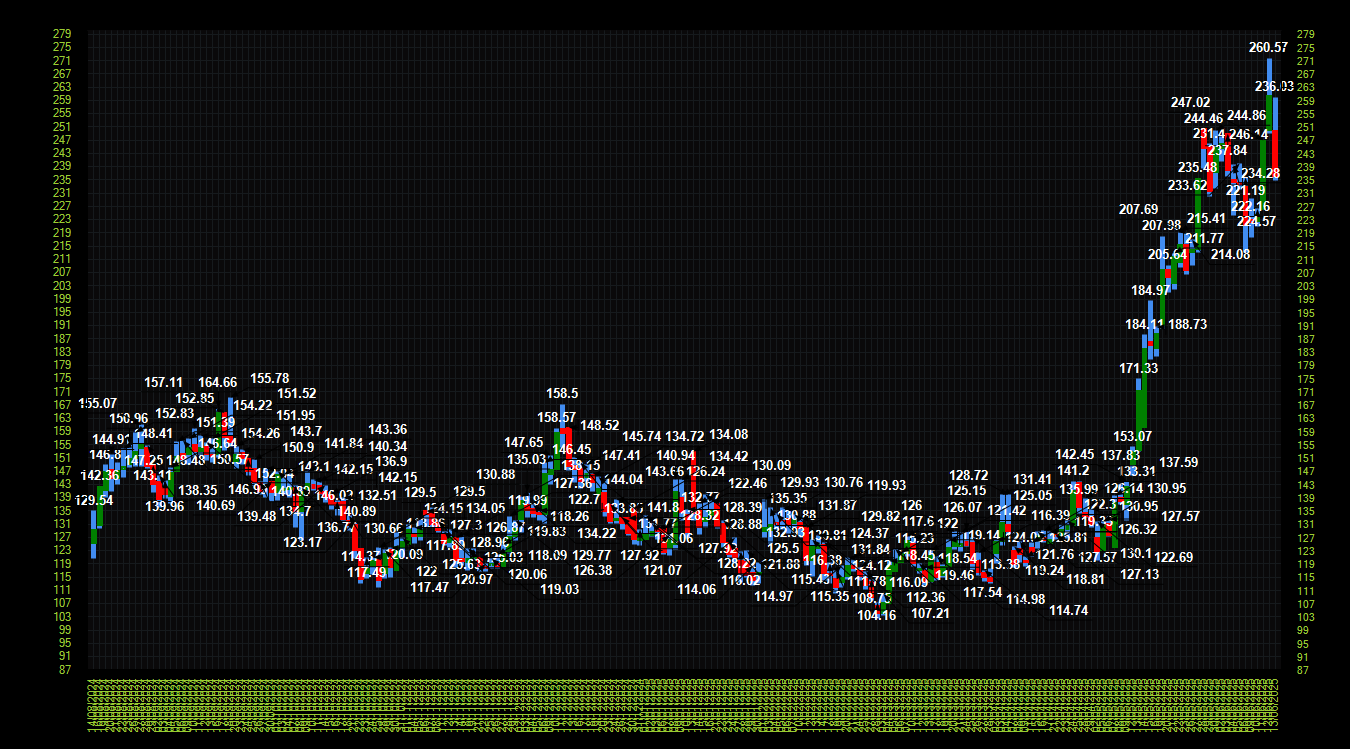
I have a candlestick chart with long list (data point) on X-Axis which becomes congested when loaded.

How to show datapoint with sufficient space . Is there any container with horizontal scroll bar to display chart just like data is displayed in DataGrid view without reducing column width.
Chartcandlestick.png

Hi,
My first and quick point of view is that if you have a chart with such a big amount of data points, there might not be a need to show all individual data points. For the axis values, you may just choose to show points at a given interval, to avoid the congestion. For the data labels, you can choose to show labels at particular points (like maxima, minima, etc.) or any predefined values set by the purposes of the study.
Best regards
Kinvieb

Be a part of the DaniWeb community

We're a friendly, industry-focused community of developers, IT pros, digital marketers, and technology enthusiasts meeting, networking, learning, and sharing knowledge.