razstec 31 Junior Poster in Training

it apears in line items = playlist["items"]# getting playlist items

rproffitt commented: I don't work hard at this. Asking for line number from above so I don't have find it. +16
Schol-R-LEA commented: So, line 71. Please say so in the future. +15
razstec 31 Junior Poster in Training

fix the quota with youtube api key, now i get
TypeError: '<' not supported between instances of 'str' and 'int'
in line items = playlist["items"]# getting playlist items

razstec 31 Junior Poster in Training

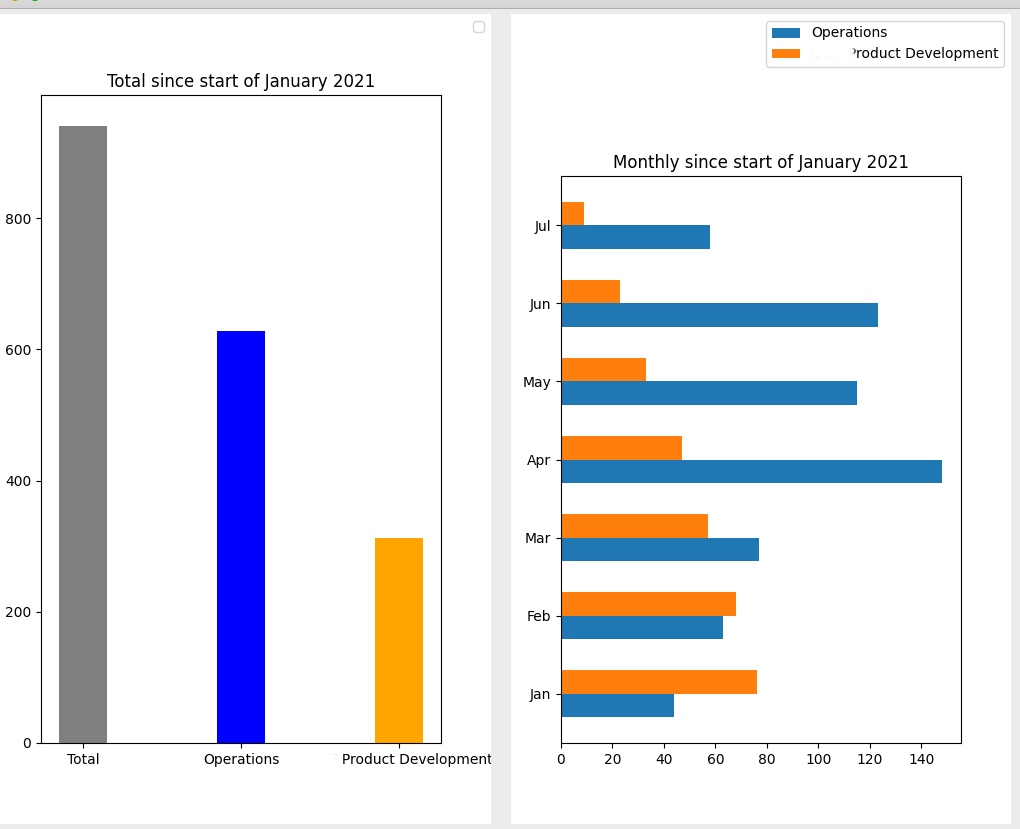
that only give the total, printed labels and it return all 3, but when applying to chart it only displays the first(Total)

added this

 for i in range(len(issue_details)):
        bars = axes.bar(range(len(issue_details.keys())), data, width=bar_width, color=colorset, label=labels[i])

and now it shows the legends but all in gray :s

tried to change color=colorset to color=colorset[i] and the legends color was right but the bars in the chart get all orange :s

fix the colors, dont ask me why but changed to more specific names and its ok now
colorset = ['SteelBlue', 'DarkOrange',

razstec 31 Junior Poster in Training

Wow thats is great, thank you so much.

had to make some changes but its working great.

Just two things, how can i had the subtitle to the first chart?

why are the colors diferent? iv check the code and its same but as you can see bellow the blue and orange are diferent ? :s

AAaaaaaaaa.png

razstec 31 Junior Poster in Training

done it :)
issue_date = datetime.strptime(datef, "%Y-%m-%dT%H:%M:%S.%f%z")

but now :(

  if period_name == "All Weeks":
            labels = range(1, 53)
            data[week_number_of_year(issue_date) - 1] +=1
        else:
            labels =["Week {}".format(x) for x in range(1, 6)]

        data[week_number_of_month(issue_date) - 1] += 1


          File "/Users/ricardosimoes/PycharmProjects/OCPP/week_report.py", line 116, in get_chart
data[week_number_of_month(issue_date) - 1] += 1
IndexError: list index out of range
razstec 31 Junior Poster in Training
issue_date = datetime.strptime(datef, "%Y-%m-%dT%H:%M:%S.%f")


    raise ValueError("unconverted data remains: %s" %

ValueError: unconverted data remains: +0000

a little improvement but still, this is one crazy timeframe....

can this help?
https://stackoverflow.com/questions/41684991/datetime-strptime-2017-01-12t141206-000-0500-y-m-dthms-fz

razstec 31 Junior Poster in Training

http://5.9.10.113/61386591/python-jira-rest-api-iso-8601

import datetime
datetime.datetime.now().astimezone().replace(microsecond=0).isoformat()

>>> 2020-03-21T14:31:43+13:00

maybe this as a hint, need to check it better
https://github.com/hmrc/jira-metrics/blob/master/jira-metrics.py

razstec 31 Junior Poster in Training

Need to make independent charts for current month, last month and since the beginnig of the year.

Been trying to make the table and then make the bar charts, got so far but cant seem to populate my code in order to build the tables with the specific data from a txt.

been playing arround but cant seem to do this, can someone help?

from tkinter import *
import calendar
import datetime
import numpy as np
import matplotlib.pyplot as plt

from datetime import datetime

datetime_object = datetime.strptime('Jun 1 2005  1:33PM', '%b %d %Y %I:%M%p')

root = Tk()
w, h = root.winfo_screenwidth(), root.winfo_screenheight()
root.geometry("%dx%d+0+0" % (w, h))
root.title("week")

dt = datetime.datetime.today()
cd = calendar.Calendar()


file = open("sample.txt")
data = file.read()

lst_last_month=[]
for tipo, data in data:
    datetime_object = datetime.strptime(data, '%b %d %Y %I:%M%p')
    if startdate <= datetime_object <= enddate:
        lst_last_month.append(data)
        lst_last_month.append(tipo)

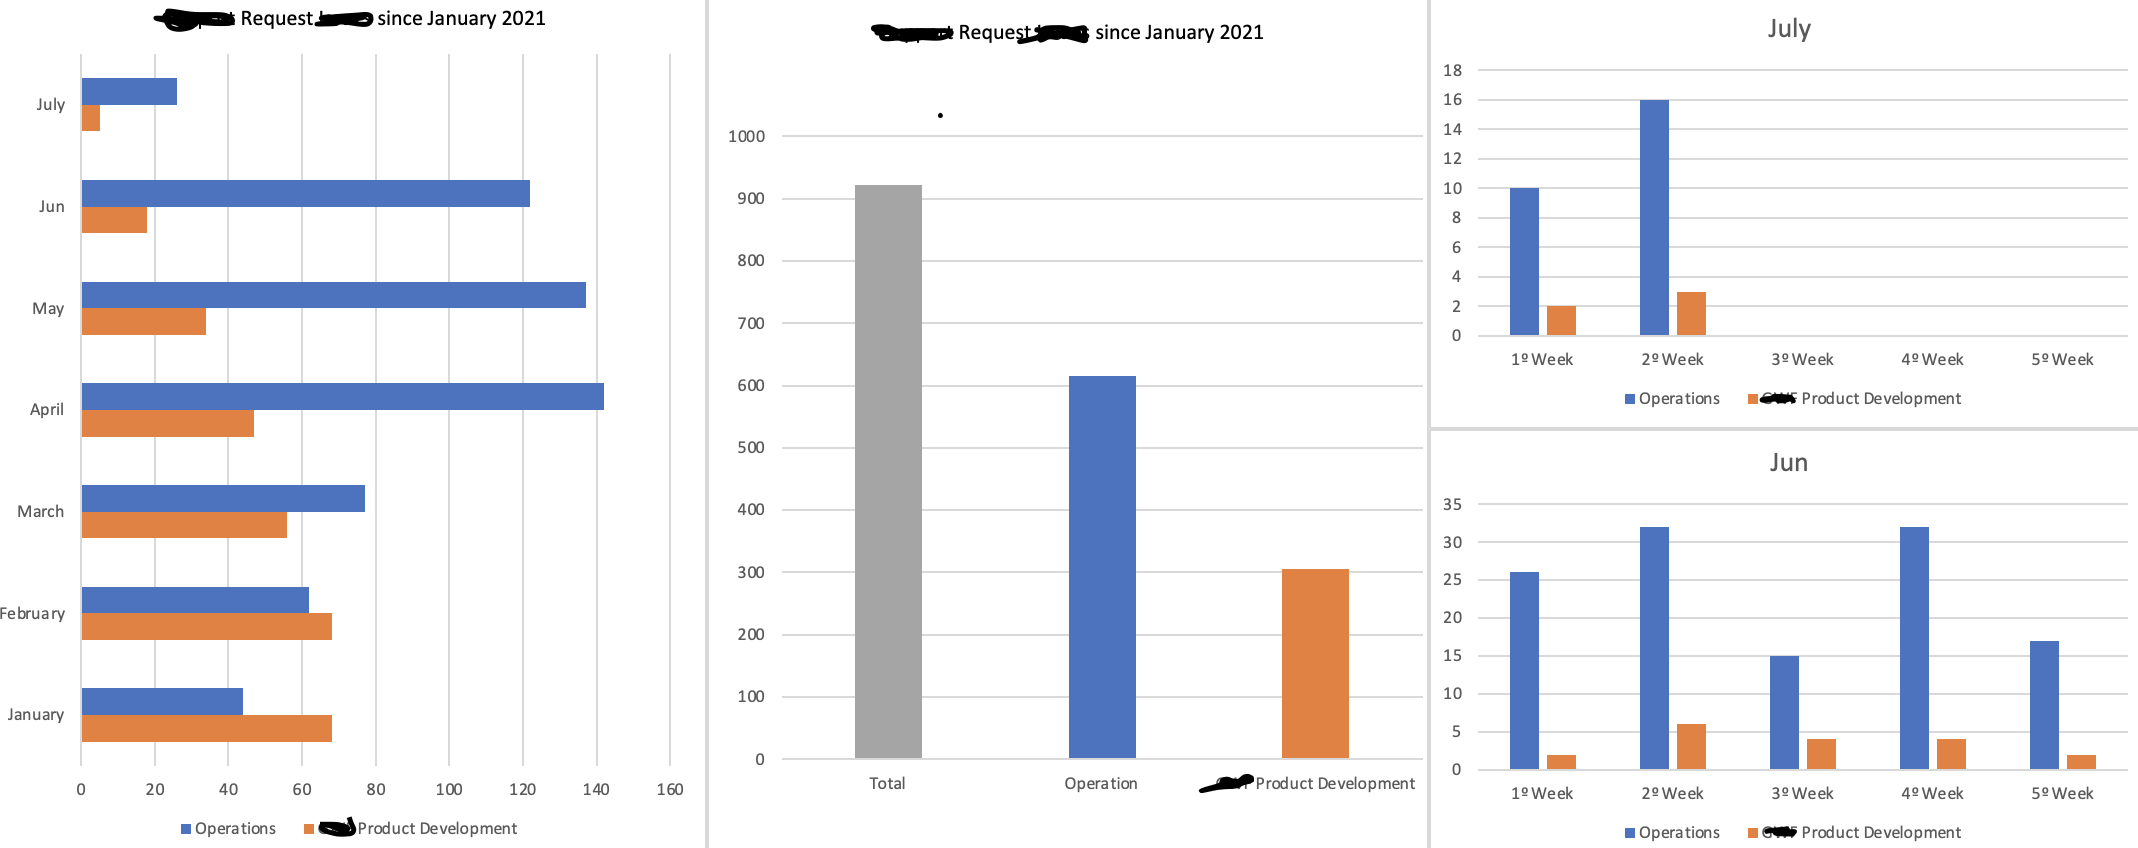
This is the expected end result

este.png

razstec 31 Junior Poster in Training

i, thanks, im still testing it and its not ready yet, but if you like its this

from xlwt import XFStyle, Font, Workbook
import xlwt
import time

filename = "Reports/"+time.strftime("%Y%m%d-%H%M%S")+'_easlo1.xls'
wb = Workbook()
sheet1 = wb.add_sheet('Test')


global valColuna, valRow
valColuna = 0
valRow = 0

def savetoxls(jsonresponse):

    #  set the font
    style = xlwt.XFStyle()
    font = xlwt.Font()
    font.bold = True  # bold
    font.name = 'Times New Roman'  # select the font
    font.underline = False  # font underline
    font.italic = False  # italics
    font.height = 300  # the font size
    font.colour_index = 4  # the font color ::1-branco, 2-vermelho, 3-verde, 4-azul
    style.font = font

    style = xlwt.easyxf('pattern: pattern solid, fore_colour red')

    # VERT_TOP, VERT_CENTER, VERT_BOTTOM, VERT_JUSTIFIED, VERT_DISTRIBUTED
    aligment = xlwt.Alignment()
    aligment.horz = aligment.HORZ_JUSTIFIED  # horizontal alignment
    aligment.vert = aligment.VERT_JUSTIFIED  # perpendicular to its way
    style.alignment = aligment

    valColuna = +1
    valRow = +1

    sheet1.col(int(valColuna)).width = 13500  # MAX:65535
    sheet1.write(int(valRow), int(valColuna), str(jsonresponse), style)  # response
    wb.save(filename)

you can also just remove the import and jsonresponse=resp_json.get(1.0, "end-1c")

razstec 31 Junior Poster in Training

found this that might help you

# Python program to find the factorial of a number provided by the user.

# change the value for a different result
num = 7

# To take input from the user
#num = int(input("Enter a number: "))

factorial = 1

# check if the number is negative, positive or zero
if num < 0:
   print("Sorry, factorial does not exist for negative numbers")
elif num == 0:
   print("The factorial of 0 is 1")
else:
   for i in range(1,num + 1):
       factorial = factorial*i
   print("The factorial of",num,"is",factorial)