Heya all,
I'm trying to render a histogram of relative frequencies using D3 in combination with AJAX.
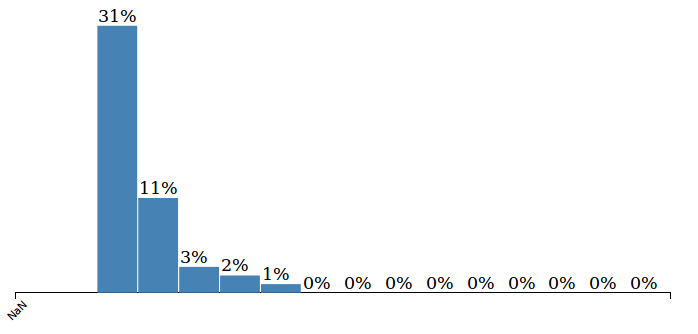
Now i'm getting all my data correctly, but when i try to draw my chart, the first 2 bars are missing.
The only error i'm getting on both firefox's and chrome's javascript console is:
Unexpected value translate(NaN,0) parsing transform attribute.
The only transform attribute i can find is:
var bar = svg.selectAll("g")
            .data(data)
            .enter().append("g")
            .attr("transform", function(data, amountOfBarsDrawn) {
                if (amountOfBarsDrawn === 0) { //first trigger is 2!
                    alert("no bars");
                    return "translate(" + barWidth + ",0)";
                }
                return "translate(" + amountOfBarsDrawn * barWidth + ",0)";
            });
The IF shows me that the first 2 bars don't even get here, as both ===0 and ===1 does not trigger (=== 2 does).
This is what the chart looks like now, with 2 bars missing on the left and NaN as part of the X axis
This is what the JSON array looks like:
[{"range":"0 - 5","percentage":12,"qty":1326},{"range":"6 - 11","percentage":38,"qty":4311},{"range":"12 - 17","percentage":31,"qty":3529},{"range":"18 - 23","percentage":11,"qty":1238},{"range":"24 - 29","percentage":3,"qty":379},{"range":"30 - 35","percentage":2,"qty":238},{"range":"36 - 41","percentage":1,"qty":130},{"range":"42 - 47","percentage":0,"qty":43},{"range":"48 - 53","percentage":0,"qty":16},{"range":"54 - 59","percentage":0,"qty":9},{"range":"60 - 65","percentage":0,"qty":5},{"range":"66 - 71","percentage":0,"qty":3},{"range":"72 - 77","percentage":0,"qty":4},{"range":"78 - 83","percentage":0,"qty":5},{"range":"84 - 89","percentage":0,"qty":3},{"range":"90 - 95","percentage":0,"qty":2}]
And here is the full code:
/**
 * Scales used to place the different elements of the chart (bars, ticks on the axisses,...)
 */

var y = d3.scale.linear()
        .range([height, 0]);

var x = d3.scale.linear()
        .range([0, width]);

var xAxis = d3.svg.axis()
        .scale(x)
        .orient(xAxisLocation);

var yAxis = d3.svg.axis()
        .scale(y)
        .orient(yAxisLocation);


//add the main SVG and give it some standard properties
var svg = d3.select("body")
        .append("svg")
        .attr("width", width + margin.left + margin.right)
        .attr("height", height + margin.top + margin.bottom)
        .attr("transform", "translate(" + margin.left + "," + margin.top + ")");

//2 empty axisses
svg.append("g")
        .attr("class", "y axis");
svg.append("g")
        .attr("class", "x axis");


d3.json(phpFileName, function(data) {

    y.domain([0, d3.max(data, function(data) {
            return data.percentage;
        })]);

    x.domain([0, d3.max(data, function(data) {
            return data.range;
        })]);

    var barWidth = width / data.length;

    //add a bar.
    var bar = svg.selectAll("g")
            .data(data)
            .enter().append("g")
            .attr("transform", function(data, amountOfBarsDrawn) {
                if (amountOfBarsDrawn === 0) { //first trigger is 2!
                    alert("no bars");
                    return "translate(" + barWidth + ",0)";
                }
                return "translate(" + amountOfBarsDrawn * barWidth + ",0)";
            });

    // extract the x labels for the axis and scale domain
    var xLabels = data.map(function(data) {
        return data["range"];
    });

    //puts the ticks on the X axis. has a possiblity for filtering.
    svg.select(".x.axis")
            .attr("transform", "translate(0," + (height) + ")")
            .call(xAxis.tickValues(xLabels.filter(function(d, i) {
                return d;
            })))
            .selectAll("text")
            .style("text-anchor", "end")
            .attr("transform", function(d) {
                return "rotate(" + xAxisLabelRotation + ")";
            });

    bar.append("rect")
            .attr("y", function(data) {
                return y(data.percentage);
            })
            .attr("x", function(data) {
                return x(data.range);
            })
            .attr("height", function(data) {
                return height - y(data.percentage);
            })
            .attr("width", barWidth - 1);

    bar.append("text")
            .attr("x", 1)
            .attr("y", function(data) {
                return y(data.percentage + 2);
            })
            .attr("dy", ".75em")
            .text(function(data) {
                return data.percentage + "%";
            });
});
and this is the file that includes that piece of javascript (should be irrelevant, as it only contains some css and some settings)
<!DOCTYPE html>
<meta charset="utf-8">
<title>Plotting a Trendline with D3.js</title>
<style>
    rect {
        fill: steelblue;
    }

    .axis path,
    .axis line {
        fill: none;
        stroke: black;
        shape-rendering: crispEdges;
    }

    .axis text {
        font-size: 10px;
        font-family: sans-serif;
    }

    .text-label {
        font-size: 10px;
        font-family: sans-serif;
    }

</style>

<body>
    <script src="d3.min.js"></script>

    <script>
        //settings van de grafiek
        var graphName = 'histogram relative frequenties';
        var height = 300;
        var width = 600;
        var margin = {top: 20, right: 20, bottom: 50, left: 20};
        var phpFileName = 'AJAX/HRF.php'; //php file for the AJAX call.


        //settings for the X axis
        var xAxisName = 'percentage'; //Name of the key of the array that has this axis' content
        var xAxisLabel = 'percentage'; //label
        var xAxisLocation = 'bottom';
        var xAxisLabelRotation = -45; //put labels diagonally for the readability

        //settings for the Y axis
        var yAxisName = 'range';
        var yAxisLabel = 'metingsbereik';
        var yAxisLocation = 'left';
        var yAxisLabelRotation = 0;

    </script>
    <script type="text/javascript" src="D3GraphRenderer_barcharts.js"></script>
</body>
