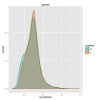
This is an R script which I used for plotting. Can anyone please give me a python code for this. Thanks in Advance !!
setwd("/pipeline/deff")
source('http://www.bioconductor.org/biocLite.R')
biocLite('cummeRbund')
library(cummeRbund)
cuff_data <- readCufflinks('deff')
pdf("allplots.pdf")
#"distbtn of expression levels for each dataset"
plot(csDensity(genes(cuff_data)))
#"compare the exp of each gene in all the conditions with scatter plot"
plot(csScatterMatrix(genes(cuff_data)))
#"distances between condition with dendrogram"
plot(csDendro(genes(cuff_data)))
#"to inspect differentially expressed genes"
plot(csVolcanoMatrix(genes(cuff_data)))
dev.off()

